The Dashboard (/app/dashboard) is the first screen after sign-in. It has two modes: a quickstart when you have no watchlist and no scans yet, and an analytics home once you have activity. After you add scheduled scans, analytics also shows a Today strip (last/next run and today's setups) above the 7-day KPIs. IVPrior is research software, not a broker.
Screen overview
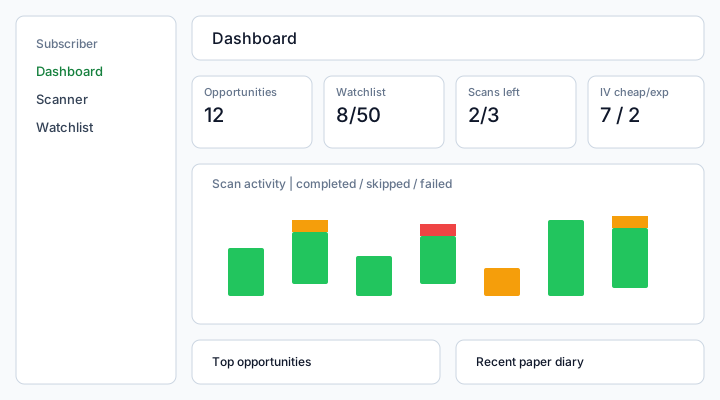
Figure: Analytics dashboard — period filters, four KPIs, scan activity, and shortcuts to scanner lists.
Two modes
Quickstart
Shows when your watchlist is empty and you have never run a scan or Analyze. You see why IVPrior ranks setups using signals plus IV (Implied Volatility / volatilidad implícita) regime, then four first steps (watchlist, scan, analyze, diary). Charts stay hidden until you have activity.
Analytics
Shows when you have at least one watchlist ticker or one scan/Analyze. Filters and KPIs stay in this mode even if the selected period has zero rows — that is a period empty state, not a return to quickstart.
If you have a schedule or a scan from today, a Today band appears first: last run, next fire, schedule health, and a This period snapshot in one row of four cards. Below that, two compact cards sit side by side: Session (next fires and today's alerts, grouped) and Today's setups (ranked tickers from the latest completed job). The charts stay below. Cron fires and Run now share Scans remaining.
What each KPI means
Opportunities
Count of opportunity rows (ranked setups) created in the selected period. The sparkline is opportunities per day in that range. The delta compares this period to the previous window of the same length. Example: 12 opportunities this week vs 9 last week shows +3 vs prior period. This is not P&L and not a fill count.
Watchlist
current / max tickers on your watchlist vs the Plan limit (maxWatchlistTickers). Inactive rows still occupy a slot. Click through to Watchlist.
Scans remaining
remaining / max async scan jobs left today. Scheduled fires and Run now use the same quota. The quota resets on the UTC day used by the API. Example: 2/3 means two Run scan or scheduled fires are left today. Click through to Scheduled scans.
IV cheap vs expensive
Counts of opportunities in the period whose IV regime is cheap vs expensive (premium looks cheap or rich vs HV (Historical Volatility / volatilidad histórica)). The hint shows how many are neutral. Example: 7 / 2 with 3 neutral means most setups in the period look cheap, not a trade signal by itself.
Scan activity
Stacked bars of completed, skipped, and failed fires in the selected period (scheduled scans and Run now). Analyze jobs are not counted. The tooltip also shows opportunity rows for that day; the Opportunities KPI sparkline remains opportunities per day.
How to use
- Open Dashboard in the sidebar (or
/app). - If you see quickstart, add a ticker and run a scan — the page switches to analytics.
- On analytics, pick a date preset (today, last 7, last 30, custom) or open Filter for IV regime and signal.
- Use KPI actions to jump to Scanner, Watchlist, or diary lists.
Permissions
Any signed-in Subscriber can open the dashboard. KPI values respect your Plan entitlements (watchlist max, daily scans). Export is not on this page.
See also: Welcome to IVPrior · Scanner · Watchlist.